Financial Highlights (Former JX Holdings, Inc.)
Statements of Income
- Statements of Income
- Balance Sheets
- Cash Flows
- Segment Information
- Former Nippon Mining Holdings Inc.
- Former Nippon Oil Corporation
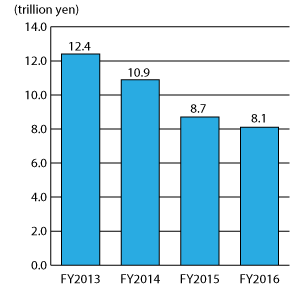
Net Sales

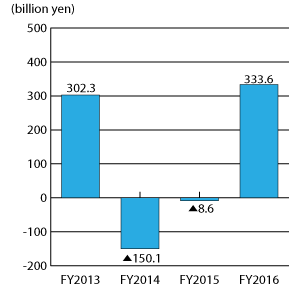
Ordinary Income (Loss)

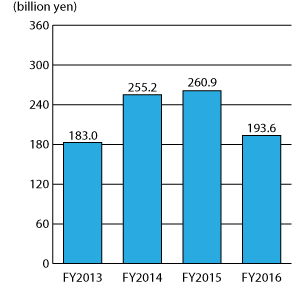
Ordinary Income (Loss) (Excluding Inventory Valuation)

FY2016
(billion yen)
| 1Q (Apr.-Jun.) |
2Q (Apr.-Sep.) |
3Q (Apr.-Dec.) |
Full Year | |
|---|---|---|---|---|
| Net sales | 1,808.8 | 3,669.8 | 5,777.4 | 8,136.0 |
| Cost of sales | 1,642.3 | 3,342.1 | 5,175.2 | 7,249.0 |
| Gross profit | 166.5 | 327.6 | 602.2 | 887.0 |
| Selling, general and administrative expenses | 139.8 | 280.1 | 431.3 | 588.6 |
| Operating income | 26.7 | 47.5 | 170.9 | 298.4 |
| (Operating income excluding inventory valuation factors) | 17.2 | 38.8 | 116.5 | 158.4 |
| Non-operating income | 28.8 | 45.4 | 56.8 | 82.0 |
| Non-operating expenses | 13.0 | 21.9 | 36.3 | 46.8 |
| Ordinary income | 42.5 | 71.0 | 191.4 | 333.6 |
| (Ordinary income excluding inventory valuation factors) | 33.0 | 62.3 | 137.0 | 193.6 |
| Special income | 1.7 | 4.1 | 12.7 | 34.8 |
| Special loss | 13.6 | 28.0 | 37.1 | 90.4 |
| Income before income taxes and minority interests | 30.6 | 47.1 | 167.0 | 278.0 |
| Income taxes | 3.6 | 22.1 | 64.5 | 96.6 |
| Profit attributable to non-controlling interests | 1.8 | -0.4 | 7.9 | 21.3 |
| Profit attributable to owners of parent | 25.2 | 25.4 | 94.5 | 160.1 |
FY2012-FY2015
(billion yen)
| FY2012 | FY2013 | FY2014 | FY2015 | |
|---|---|---|---|---|
| Net sales | 11,219.5 | 12,412.0 | 10,882.5 | 8,737.8 |
| Cost of sales | 10,431.4 | 11,637.6 | 10,532.9 | 8,222.6 |
| Gross profit | 788.1 | 774.4 | 349.6 | 515.2 |
| Selling, general and administrative expenses | 536.6 | 560.7 | 568.4 | 577.5 |
| Operating income | 251.5 | 213.7 | -218.9 | -62.2 |
| (Operating income excluding inventory valuation factors) | 194.2 | 94.4 | 186.4 | 207.3 |
| Non-operating income | 123.9 | 129.1 | 127.8 | 96.2 |
| Non-operating expenses | 47.0 | 40.4 | 59.0 | 42.6 |
| Ordinary income | 328.3 | 302.3 | -150.1 | -8.6 |
| (Ordinary income excluding inventory valuation factors) | 271.0 | 183.0 | 255.2 | 260.9 |
| Special income | 15.4 | 16.8 | 59.6 | 44.6 |
| Special loss | 71.7 | 98.8 | 164.5 | 366.0 |
| Income before income taxes and minority interests | 272.0 | 220.3 | -255.0 | -330.0 |
| Income taxes | 81.0 | 94.2 | 35.0 | -17.1 |
| Profit attributable to non-controlling interests | 31.6 | 19.1 | -12.8 | -34.4 |
| Profit attributable to owners of parent | 159.5 | 107.0 | -277.2 | -278.5 |
