Financial Highlights (Former JX Holdings, Inc.)
Balance Sheets
- Statements of Income
- Balance Sheets
- Cash Flows
- Segment Information
- Former Nippon Mining Holdings Inc.
- Former Nippon Oil Corporation
Financial Statement
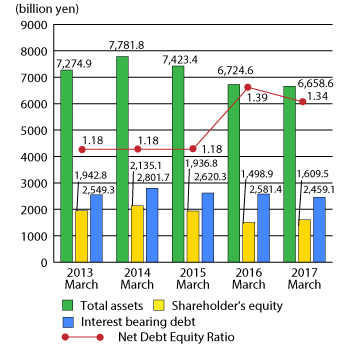
FY2016
(billion yen)
| June.30, 2016 | Sep.30, 2016 | Dec.31, 2016 | Mar.31, 2017 | |
|---|---|---|---|---|
| Assets | 6,311.9 | 6,217.1 | 6,764.9 | 6,658.6 |
| Current assets | 2,386.2 | 2,344.8 | 2,709.4 | 2,684.9 |
| Non-current assets | 3,925.7 | 3,872.3 | 4,055.5 | 3,973.7 |
| Property, plant and equipment | 2,403.2 | 2,373.0 | 2,438.5 | 2,411.1 |
| Intangible assets | 110.2 | 107.2 | 109.7 | 107.2 |
| Investment and other assets | 1,412.3 | 1,392.1 | 1,507.3 | 1,455.4 |
| Liabilities | 4,482.5 | 4,412.7 | 4,802.4 | 4,616.9 |
| Current liabilities | 2,585.7 | 2,422.1 | 2,661.1 | 2,566.4 |
| Non-current liabilities | 1,896.8 | 1,990.6 | 2,141.3 | 2,050.5 |
| Net assets | 1,829.4 | 1,804.4 | 1,962.5 | 2,041.7 |
| Shareholders' equity | 1,313.0 | 1,313.2 | 1,362.4 | 1,429.3 |
| Accumulated other comprehensive income (loss) | 108.2 | 90.1 | 176.5 | 180.2 |
| Non-controlling interests | 408.2 | 401.1 | 423.6 | 432.2 |
(billion yen)
| June.30, 2016 | Sep.30, 2016 | Dec.31, 2016 | Mar.31, 2017 | |
|---|---|---|---|---|
| Shareholders' equity* | 1,421.3 | 1,403.3 | 1,538.9 | 1,609.5 |
| Shareholders' equity ratio | 22.5% | 22.6% | 22.7% | 24.2% |
| Interest bearing debt | 2,504.5 | 2,433.4 | 2,540.4 | 2,459.1 |
| Net Interest bearing debt | 2,206.2 | 2,138.8 | 2,277.3 | 2,161.7 |
| Net debt equit ratio | 1.55 | 1.52 | 1.48 | 1.34 |
FY2012-FY2015
(billion yen)
| Mar.31, 2013 | Mar.31, 2014 | Mar.31, 2015 | Mar.31, 2016 | |
|---|---|---|---|---|
| Assets | 7,274.9 | 7,781.8 | 7,423.4 | 6,724.6 |
| Current assets | 3,737.8 | 3,765.6 | 2,996.4 | 2,651.3 |
| Non-current assets | 3,537.1 | 4,016.2 | 4,427.0 | 4,073.3 |
| Property, plant and equipment | 2,190.7 | 2,389.2 | 2,555.6 | 2,453.5 |
| Intangible assets | 134.8 | 132.7 | 136.2 | 117.4 |
| Investment and other assets | 1,211.6 | 1,494.3 | 1,735.2 | 1,502.4 |
| Liabilities | 4,947.5 | 5,155.5 | 4,993.6 | 4,796.2 |
| Current liabilities | 3,317.5 | 3,454.9 | 3,066.5 | 2,755.0 |
| Non-current liabilities | 1,630.0 | 1,700.6 | 1,927.1 | 2,041.2 |
| Net assets | 2,327.4 | 2,626.3 | 2,429.8 | 1,928.4 |
| Shareholders' equity | 1,896.4 | 1,962.3 | 1,626.4 | 1,307.6 |
| Accumulated other comprehensive income (loss) | 46.3 | 172.8 | 310.4 | 191.3 |
| Non-controlling interests | 384.7 | 491.2 | 493.0 | 429.5 |
(billion yen)
| Mar.31, 2013 | Mar.31, 2014 | Mar.31, 2015 | Mar.31, 2016 | |
|---|---|---|---|---|
| Shareholders' equity* | 1,942.8 | 2,135.1 | 1,936.8 | 1,498.9 |
| Shareholders' equity ratio | 26.7% | 27.4% | 26.1% | 22.3% |
| Interest bearing debt | 2,549.3 | 2,801.7 | 2,620.3 | 2,581.4 |
| Net Interest bearing debt | 2,299.2 | 2,520.0 | 2,291.0 | 2,088.7 |
| Net debt equit ratio | 1.18 | 1.18 | 1.18 | 1.39 |