Financial Highlights (Former JX Holdings, Inc.)
Segment Information
- Statements of Income
- Balance Sheets
- Cash Flows
- Segment Information
- Former Nippon Mining Holdings Inc.
- Former Nippon Oil Corporation
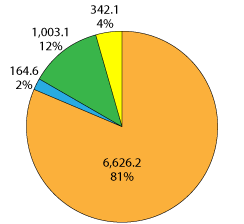
Net Sales (FY2016)

Ordinary Income


FY2016
Net Sales
(billion yen)
| 1Q (Apr.-Jun.) |
2Q (Apr.-Sep.) |
3Q (Apr.-Dec.) |
Full Year | |
|---|---|---|---|---|
| Energy | 1,449.6 | 2,965.8 | 4,701.2 | 6,626.2 |
| Oil and Natural Gas E&P | 56.1 | 87.4 | 125.8 | 164.6 |
| Metals | 233.8 | 464.6 | 715.4 | 1,003.1 |
| Others | 69.3 | 152.0 | 235.0 | 342.1 |
| Total | 1,808.8 | 3,669.8 | 5,777.4 | 8,136.0 |
Ordinary Income
(billion yen)
| 1Q (Apr.-Jun.) |
2Q (Apr.-Sep.) |
3Q (Apr.-Dec.) |
Full Year | |
|---|---|---|---|---|
| Energy | 37.4 | 52.2 | 139.8 | 242.8 |
| Oil and Natural Gas E&P | (3.3) | (2.0) | 8.5 | 18.3 |
| Metals | (1.4) | 0.5 | 11.2 | 25.0 |
| Others | 9.8 | 20.3 | 31.9 | 47.5 |
| Total | 42.5 | 71.0 | 191.4 | 333.6 |
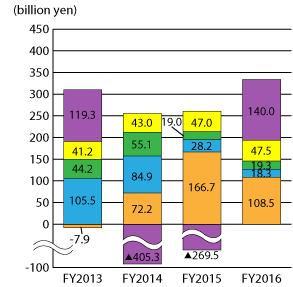
Ordinary Income (Excluding Inventory Valuation)
(billion yen)
| 1Q (Apr.-Jun.) |
2Q (Apr.-Sep.) |
3Q (Apr.-Dec.) |
Full Year | |
|---|---|---|---|---|
| Energy | 27.2 | 41.7 | 83.6 | 108.5 |
| Oil and Natural Gas E&P | (3.3) | (2.0) | 8.5 | 18.3 |
| Metals | (0.7) | 2.3 | 13.0 | 19.3 |
| Others | 9.8 | 20.3 | 31.9 | 47.5 |
| Total | 33.0 | 62.3 | 137.0 | 193.6 |
Ordinary Income by Segment
(billion yen)
| 1Q (Apr.-Jun.) |
2Q (Apr.-Sep.) |
3Q (Apr.-Dec.) |
Full Year | |
|---|---|---|---|---|
| Ordinary Income (billion yen) | 42.5 | 71.0 | 191.4 | 333.6 |
| (Excluding Inventory Valuation) | 33.0 | 62.3 | 137.0 | 193.6 |
| ■Energy | 37.4 | 52.2 | 139.8 | 242.8 |
| Petroleum Products | 7.5 | 9.7 | 31.6 | 29.3 |
| Petrochemicals | 19.7 | 32.0 | 52.0 | 79.2 |
| Inventory Valuation | 10.2 | 10.5 | 56.2 | 134.3 |
| ■Oil and Natural Gas E&P | (3.3) | (2.0) | 8.5 | 18.3 |
| ■Metals | (1.4) | 0.5 | 11.2 | 25.0 |
| Resource Development Business | (12.0) | (21.1) | (26.8) | (28.1) |
| Smelting and Refining Business | 5.8 | 11.3 | 20.5 | 20.6 |
| Electronic Material Business | 4.0 | 8.4 | 13.4 | 18.3 |
| Recycling and Environmental Services Business | 0.7 | 2.4 | 2.9 | 4.9 |
| Titanium | 0.8 | 1.3 | 3.0 | 3.6 |
| Inventory Valuation | (0.7) | (1.8) | (1.8) | 5.7 |
| ■Others | 9.8 | 20.3 | 31.9 | 47.5 |
FY2012-FY2015
Net Sales
(billion yen)
| FY2012 | FY2013 | FY2014 | FY2015 | |
|---|---|---|---|---|
| Energy | 9,699.6 | 10,755.0 | 9,124.8 | 7,122.4 |
| Oil and Natural Gas E&P | 173.1 | 202.2 | 226.4 | 175.8 |
| Metals | 927.5 | 1,039.1 | 1,156.0 | 1,049.7 |
| Others | 419.3 | 415.7 | 375.3 | 389.9 |
| Total | 11,219.5 | 12,412.0 | 10,882.5 | 8,737.8 |
Ordinary Income
(billion yen)
| FY2012 | FY2013 | FY2014 | FY2015 | |
|---|---|---|---|---|
| Energy | 161.6 | 108.2 | (334.6) | (97.1) |
| Oil and Natural Gas E&P | 93.6 | 105.5 | 84.9 | 28.2 |
| Metals | 44.0 | 47.4 | 56.6 | 13.3 |
| Others | 29.1 | 41.2 | 43.0 | 47.0 |
| Total | 328.3 | 302.3 | (150.1) | (8.6) |
Ordinary Income (Excluding Inventory Valuation)
(billion yen)
| FY2012 | FY2013 | FY2014 | FY2015 | |
|---|---|---|---|---|
| Energy | 102.8 | (7.9) | 72.2 | 166.7 |
| Oil and Natural Gas E&P | 93.6 | 105.5 | 84.9 | 28.2 |
| Metals | 45.5 | 44.2 | 55.1 | 19.0 |
| Others | 29.1 | 41.2 | 43.0 | 47.0 |
| Total | 271.0 | 183.0 | 255.2 | 260.9 |
Ordinary Income by Segment
(billion yen)
| FY2012 | FY2013 | FY2014 | FY2015 | |
|---|---|---|---|---|
| Ordinary Income (billion yen) | 328.3 | 302.3 | (150.1) | (8.6) |
| (Excluding Inventory Valuation) | 271.0 | 183.0 | 255.2 | 260.9 |
| ■Energy | 161.6 | 108.2 | (334.6) | (97.1) |
| Petroleum Products | 56.1 | (77.5) | 57.1 | 89.1 |
| Petrochemicals | 46.7 | 69.6 | 15.1 | 77.6 |
| Inventory Valuation | 58.8 | 116.1 | (406.8) | (263.8) |
| ■Oil and Natural Gas E&P | 93.6 | 105.5 | 84.9 | 28.2 |
| ■Metals | 44.0 | 47.4 | 56.6 | 13.3 |
| Resource Development Business | 26.6 | 22.5 | 18.1 | (24.2) |
| Smelting and Refining Business | 11.1 | 12.5 | 16.8 | 13.3 |
| Electronic Material Business | 6.3 | 9.0 | 16.6 | 21.9 |
| Recycling and Environmental Services Business | 2.5 | 5.6 | 6.7 | 5.0 |
| Titanium | (1.0) | (5.4) | (3.1) | 3.0 |
| Inventory Valuation | (1.5) | 3.2 | 1.5 | (5.7) |
| ■Others | 29.1 | 41.2 | 43.0 | 47.0 |
