Our Response to Climate Change Risks and Opportunities (TCFD)
Basic Approach
As an energy and materials company group, the ENEOS Group recognizes that its response to climate change involves both material management risks and opportunities. We believe that developing practical solutions to climate change will enable us to continuously generate profits into the future. As a clear expression of this intent, in our Long-Term Vision we state that we will take on the challenge of achieving both a stable supply of energy and materials and the realization of a carbon-neutral society.
The international situation surrounding energy and materials is becoming increasingly uncertain. In order to respond more flexibly to this uncertainty, we have formulated our Carbon Neutrality Plan 2025 edition in conjunction with the fourth Medium-Term Management Plan, which was announced in May 2025. In our Carbon Neutrality Plan, we have presumed three societal scenarios, and we believe that we can increase our resilience by formulating strategies based on these scenarios.
We have set targets for reducing operational greenhouse gas emissions (Scope 1 and 2) in line with government policy. Compared to fiscal 2013, the base year, we aim to reduce emissions by 60% by fiscal 2035, by 73% by fiscal 2040, and to achieve carbon neutrality by fiscal 2050. Regarding our contribution to reducing downstream greenhouse gas emissions from sold products (Scope 3, avoided emissions), we will lead the supply of energies and materials necessary for the transition to meet societal demand for the reduction of greenhouse gas emissions, with the aim of achieving carbon neutrality, including Scope 3, by fiscal 2050.
To enhance and broaden its disclosures, the Company signed a statement of support for the recommendations of the Task Force on Climate-related Financial Disclosures (TCFD) in May 2019. The Company also endorsed the Challenge Zero initiative of the Japan Business Federation (Keidanren) in June 2020, and is working on the development of technologies to mitigate the impacts of climate change. Additionally, with an eye on the realization of carbon neutrality by 2050 and social transformation, the Company participates in the Green Transformation (GX) League and actively makes recommendations for the design of the emissions trading scheme (GX-ETS), which is set to begin in 2026. The GX League, a framework based on the basic concept of the Ministry of Economy, Trade and Industry (METI), was established as a forum for companies aiming to achieve sustainable growth in the present and future to collaborate with government and academia.
We will respond to the changing demands of our customers and society as the times change, and promote initiatives to prepare for multiple societal scenarios in a rational manner so as to reliably deliver the energy and materials needed.
Overview of TCFD Disclosure Recommendations
| Governance | Disclose the organization’s governance around climate-related risks and opportunities. | Supplemental information | References |
|---|---|---|---|
| a Describe the board’s oversight of climate-related risks and opportunities. | Incorporating climate change risks and opportunities into management strategies | ||
| b Describe management’s role in assessing and managing climate change-related risks and opportunities. | Senior management manages the progress of management strategies | ||
| Strategy | Disclose the actual and potential impacts of climate-related risks and opportunities on the organization’s businesses, strategy, and financial planning where such information is material. | Supplemental information | References |
| a Describe the climate-related risks and opportunities the organization has identified over the short, medium, and long term. | Identification of transition risks, opportunities, and physical risks, clarification of the time horizon, disclosure of quantitative impacts, and reflection of them in management strategies | ||
| b Describe the impact of climate-related risks and opportunities on the organization’s businesses, strategy, and financial planning. | |||
| c Describe the resilience of the organization’s strategy, taking into consideration different climate-related scenarios, including a 2°C or lower scenario. | Consideration of multiple scenarios, including 2°C or lower, when formulating strategies | ||
| Risk Management | Disclose how the organization identifies, assesses, and manages climate-related risks. | Supplemental information | References |
| a Describe the organization’s processes for identifying and assessing climate-related risks. | Use of enterprise risk management (ERM) to identify and evaluate risks and opportunities, incorporate them into management strategies, and manage progress | ||
| b Describe the organization’s processes for managing climate-related risks. | |||
| c Describe how processes for identifying, assessing, and managing climate-related risks are integrated into the organization’s overall risk management. | |||
| Metrics and Targets | Disclose the metrics and targets used to assess and manage relevant climate-related risks and opportunities where such information is material. | Supplemental information | References |
| a Disclose the metrics used by the organization to assess climate-related risks and opportunities in line with its strategy and risk management process. | Evaluation using the degree of impact and probability of occurrence as indicators | ||
| b Disclose Scope 1, Scope 2, and, if appropriate, Scope 3 greenhouse gas (GHG) emissions and the related risks. | Disclosure of Scope 1, 2 and 3 GHG emissions | ||
| c Describe the targets used by the organization to manage climate-related risks and opportunities and performance against targets. | Disclosure of basic plan | ||
Governance System for Climate Change
In 2024, the Group established the Carbon Neutrality Promotion Committee, led by the CTO, to update basic strategies in response to changes in the business environment. The basic strategies discussed by the Carbon Neutrality Promotion Committee will be reflected in future medium-term management plans and other management strategies. The medium-term management plan and other management strategies are discussed by the ENEOS Holdings Executive Council, chaired by the ENEOS Holdings CEO, which deliberates on the Group’s response to climate change, including in future business plans, and manages and evaluates the status of climate initiatives from a cross-functional perspective. The council reports the results of its deliberations, management, and evaluation to the ENEOS Holdings Board of Directors, which also monitors and supervises the council.
Deliberations in Fiscal 2024
Board of Directors and Executive Council
- Results of ESG activities in fiscal 2023 and KPIs for material ESG issues in fiscal 2024
- Update of the Carbon Neutrality Plan
- Status report on the Carbon Neutrality Promotion Committee
Response to Climate Change and Link to Executive Remuneration
Remuneration for the Company’s directors consists of a monthly remuneration in accordance with role, performance-linked bonuses, and share-based remuneration. The performance indicators on which share-based remuneration was based include greenhouse gas emissions reduction, along with operating profit excluding inventory valuation, ROE, and other financial indicators. In line with the formulation of the fourth Medium-Term Management Plan, starting from fiscal 2025, we adopted ROIC, in addition to relative TSR, as an indicator for share-based remuneration. By referencing our stock price, we will incorporate part of the market’s evaluation of our environmental efforts and provide an incentive to support the improvement of corporate value over the medium to long term.
Scenario Analysis
The Group conducts scenario analysis in response to changes in the external environment1. We referenced the IEA2 World Energy Outlook (WEO) 2024 and IPCC AR63 for scenario analysis, and the IPCC RCP4 for the assessment of physical risks (responses to climate and sea level change, etc.).
For its Carbon Neutrality Plan 2025 edition, the Group made future projections based on the IEA WEO STEPS5, APS6, NZE7 and IPCC AR6 to presume the following three societal scenarios.
Beyond Scenario (+1.5 to 2.0°C)8
Demand for fossil fuels declines, the introduction of renewable energy progresses significantly, economic efficiency improves markedly with the introduction of innovative technologies such as hydrogen and CCS, and there is progress in decarbonization worldwide.
Current Scenario (+2.0 to 2.5°C)8
Low-carbon measures such as LNG and biomass and the introduction of economically viable renewable energy progress, decarbonization technologies, such as CCS, are also partially implemented, and environmental initiatives and policies progress, mainly in developed countries.
Drift Scenario (+3.0 to 4.0°C)8
Continued dependence on low-cost fossil fuels limits the introduction of renewable energy and innovative decarbonization technologies, and there is limited global progress in decarbonization.
As we transition away from a fossil fuel-centered portfolio to low-carbon and decarbonized sectors, we will work to achieve both a stable supply of energy and materials and the realization of a carbon-neutral society, while closely monitoring fuel oil demand trends and other factors. The Group’s Carbon Neutrality Plan 2025 edition has a high level of resilience to various scenarios, including a 1.5°C rise in temperature worldwide. If society as a whole makes further progress toward achieving carbon neutrality and Japan moves closer to the 1.5°C scenario, we will also further accelerate our efforts, leading the supply of energies and materials that contribute to Japan’s transition and a circular economy, which will result in a significant contribution to the development of a decarbonized society.
- 1Implemented by the Carbon Neutrality Promotion Committee
- 2International Energy Agency: The World Energy Outlook published by the agency contains several decarbonization scenarios
- 3The Sixth Assessment Report published by the Intergovernmental Panel on Climate Change
- 4Representative Concentration Pathways: Scenarios regarding temperature rises, etc. that assume future greenhouse gas concentrations
- 5Stated Policies Scenario: A scenario that reflects government policies already announced
- 6Announced Pledges Scenario: A scenario that assumes that countries will achieve their ambitious targets
- 7Net Zero Emissions by 2050 Scenario: A scenario in which the world will achieve net zero in 2050
- 8Global average temperature in 2040 (based on the average temperature from 1850 to 1900)
Changes in the Business Environment
Since the announcement of our third Medium-Term Management Plan and Carbon Neutrality Plan in May 2023, the business environment has undergone many changes. In addition to advances in AI technology, various countries are establishing frameworks to address climate change. At the same time, however, the situation surrounding energy and materials is becoming increasingly uncertain due to factors such as the invasion of Ukraine and rising geopolitical tensions in the Middle East. Furthermore, according to the World Meteorological Organization, the global average temperature in 2024 reached its highest level on record, and global warming continues to advance. The Government of Japan approved its 7th Strategic Energy Plan and the GX2040 Vision, setting new reduction targets of 60% by fiscal 2035 and 73% by fiscal 2040 (both compared to fiscal 2013), further advancing the GX policy.
While the overall direction toward carbon neutrality remains unchanged, we believe that the speed at which carbon neutrality will be achieved may change in the current environment, where there is a growing emphasis on a stable and economical energy supply. To respond more flexibly to uncertainty, we have formulated a highly resilient carbon neutrality strategy based on three presumed societal scenarios.
Financial Impacts of Climate Change-Related Risks and Opportunities
We have developed and operate an enterprise risk management (ERM) system to identify and analyze Group management risks and ensure appropriate responses. Based on this process, we recognize that our response to climate change involves both material management risks and opportunities, which we have identified as shown in the table below.
Regarding financial impacts, among transition risks, higher costs for achieving carbon neutrality are estimated within the scope of our CO2 emissions reduction targets, and decline in petroleum demand is estimated within the scope of our presumed societal scenarios. Physical risks are estimated based on the IPCC RCP8.5 scenario* as the stress case. These estimates include many potential risks, uncertainties, and assumptions, and changes in material factors may lead to significantly different outcomes.
- *Intergovernmental Panel on Climate Change (IPCC) assessment scenario, in which the global average temperature rises by about 4°C by 2100 compared to the period from 1986 to 2005
Financial Impacts of Climate Change-Related Risks and Opportunities
| Category | Financial impact | ||||
|---|---|---|---|---|---|
| Short term (2027) |
Medium term (2030) |
Long term (2040) |
Assessment method | ||
| Transition risks |
|
None | Approx. \27 billion/year | Approx. \260 billion/year | Amount of decline in operating profit when the 2030 target reduction of 6 million tonnes and the 2040 target reduction of 15 million tonnes are multiplied by the internal carbon price according to time period |
|
Limited impacts | Approx. ¥20 billion/year decline | Approx. ¥80 billion/year decline | Amount of decline in operating profit if domestic petroleum demand is expected to decrease by approximately 10% in 2030 and by 40% in 2040 compared to 2023 (calculated based on fiscal 2023 operating profit) | |
|
Limited risk | Estimation of oil upstream asset reserves based on the number of extractable years discounted by current production | |||
| Physical risks |
|
¥100 to ¥200 million/year | Referenced the IPCC RCP8.5 scenario for estimation of the total amount of damage (decrease in operating profit) using WRI Aqueduct*, etc. for 31 of our facilities and assets in Japan, such as refineries
|
||
|
Limited risk | Estimated from amount of increase (approx. 0.2 meters) in sea level around Japan as of 2040 as projected by Aqueduct | |||
| Opportunities |
|
Up to ¥10 billion/year | Up to ¥30 billion/year | Up to ¥180 billion/year | Operating profit estimated based on certain assumptions about the estimated market size, the Company’s market share, and operating profit margin due to an expected increase in demand for renewable energy, hydrogen, and carbon-neutral fuels associated with advancements toward a decarbonized, circulating society |
|
Up to ¥50 billion/year | Up to ¥120 billion/year | Up to ¥220 billion/year | Demand for LNG, biofuels, etc. is expected to increase as energy sources during the transition period toward carbon neutrality. Operating profit is estimated based on certain assumptions regarding the estimated market size, the Company’s market share, and operating profit margin. | |
- Notes:
- The above was developed in May 2025. It will be reviewed as appropriate in accordance with changes in various conditions surrounding the economy and the formulation of our medium- to long-term business strategies.
† Transition risks: The financial impact of higher costs for achieving carbon neutrality was reviewed in October 2025.
Assessment of Physical Risks
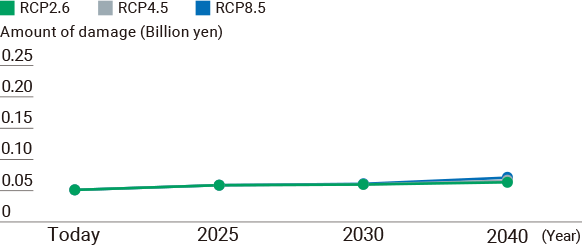
In assessing physical risks, in fiscal 2023 we examined the risks from the objective perspective of Sompo Risk Management Inc., an external expert, referring to the IPCC RCP scenario. For the scenarios, we have adopted RCP8.5 (equivalent to a 4°C increase) as a stress case, and RCP4.5 (equivalent to STEPS in IEA WEO) and RCP2.6 (equivalent to APS) as cases that are close to our base-case scenario. As a result of simulating the amount of damage caused by flooding using WRI Aqueduct and other means for 31 of our facilities and assets in Japan, such as refineries, our current estimate of the average annual amount of damage in the stress case is over 100 million yen, and we expect the average annual amount of damage to be about 100 million to 200 million yen in 2040.
There is a tendency for damage to be greater in locations where storm surges are a concern due to large rivers in the vicinity or strong winds during the passage of typhoons. We are implementing measures to mitigate these risks to ensure that the overall impact is minimal.
Expected Annual Amount of Damage Due to Inland Flooding
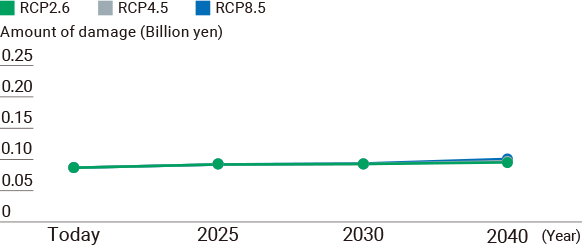
Expected Annual Amount of Damage Due to Coastal Flooding
Building a Business Portfolio That Addresses Risks and Opportunities
In response to growing uncertainty, including heightened energy security awareness, US policy risk, increased cost toward decarbonization, and difficulties in predicting projects’ profitability due to inflation and other factors, the Group revised its Medium-Term Management Plan in May 2025. Although our long-term goal of decarbonization remains unchanged, in the current environment there is a growing emphasis on a stable and economical energy supply while moving toward decarbonization, and we believe that the technological turning point is likely to occur later than we had previously anticipated. In reviewing our Medium-Term Management Plan, we will conduct scenario analysis based on multiple societal scenarios, including a scenario of a temperature rise of 2°C or less, and strive to improve our resilience. At the same time, we will continue our efforts to establish technological and strategic advantages in preparation for the arrival of the turning point, whenever it may occur.
Under the fourth Medium-Term Management Plan, we will streamline and increase the efficiency of existing businesses and transition to a robust management structure. Furthermore, to enable portfolio restructuring, we will enhance our process for strategically selecting, developing, and appointing strong leaders at an early stage who can overcome uncertain times. At the same time, we will establish a future personnel portfolio and thoroughly implement talent management centered on the assignment of the right person to the right job. We will also steadily invest capital in promising fields while monitoring trends in the low-carbon market, which has strong possibilities.
ROIC / Scale of Earnings by Business Area
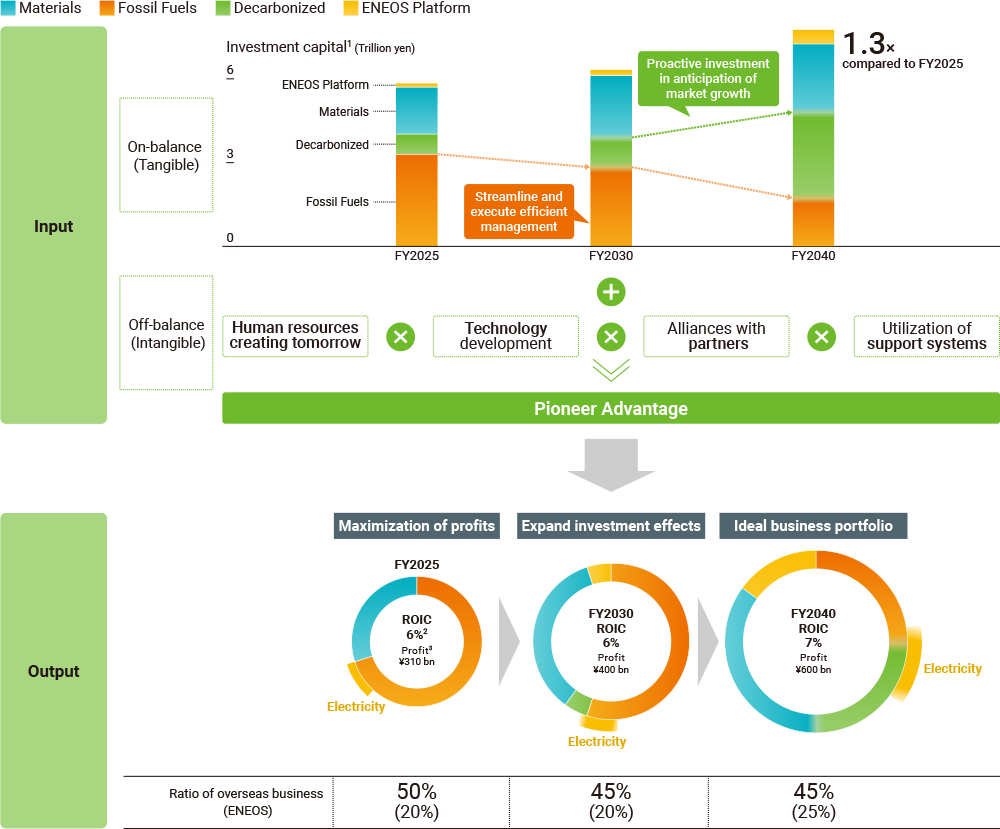
- 1Including JX Advanced Metals (JXAM), NIPPO, etc.
- 2Operating profit incl. discontinued operations / excl. inventory valuation
- 3Consolidated financial statements of the ENEOS Group excluding one-time factors (gain on the sale of JXAM shares, impairment of goodwill in the Petroleum Products business) and the impact of time-lag, and including JXAM operating profit as share of profit of entities accounted for using equity method.
Internal Carbon Pricing System
The Group has introduced an internal carbon price to quantitatively evaluate the economic impact of CO2 emissions and promote the creation of an appropriate business portfolio. Previously, we used an internal carbon price of $50/tonne as a reference, but to respond to uncertainties in the business environment, in July 2025 we set a price* according to the time period, such as $115/tonne for fiscal 2040. We also use the internal carbon price in investment decisions, and incorporate the risks, opportunities and impacts associated with increases or decreases in CO2 emissions into our management decisions.
The internal carbon price is updated as the business environment evolves.
- *The internal carbon price is set the same for all principal operating companies.
Realizing a Just Transition
In building our business portfolio over the long term for a decarbonized society, we believe that reducing social and economic burdens is essential to the continuity of social and economic activity during the transition period. The most effective way we can contribute to a just transition is by fully leveraging our strengths, including our refineries, supply chain and other existing assets, our highly professional and motivated human capital, and our close relationships with local communities, including local economies.
For example, in building an SAF supply chain, which is currently in progress, we can use our refineries, logistics, and service station network to establish a competitive advantage, which will enable us to minimize any adverse impacts on our employees or related companies as well as on the employment and labor conditions and people’s livelihoods in local communities.
Our approach is aligned with the International Labour Organization’s “Guidelines for a just transition towards environmentally sustainable economies and societies for all.”
We also conduct human rights due diligence based on the United Nations Guiding Principles on Business and Human Rights every three years, and we will carry out regular reviews and implement appropriate measures as we pursue our initiatives during the transition.
Indicators and Targets
In the Group’s Carbon Neutrality Plan 2025 edition, we aim to achieve net-zero operational greenhouse gas emissions (Scope 1+2) by fiscal 2050. To achieve this target, we will promote energy saving, fuel conversion, and utilization of renewable energies at refineries and plants, as well as CO2 fixation through CCS and the enhancement of biogenic CO2 removals, including removal by forests. Regarding our contribution to reducing downstream greenhouse gas emissions from sold products (Scope 3, avoided emissions), we aim to contribute to the realization of a carbon-neutral society by 2050, working in step with the government and other companies. To achieve this, we will lead the supply of energies and materials necessary for the transition. In the energy and materials transition, we will promote measures such as low-carbon fossil fuels and products, expansion of renewable energies, utilization of resources such as biomass, decarbonization of fossil fuels, and utilization of hydrogen. For a circular economy, we will promote resource recycling and resource conservation.
Furthermore, we have set interim targets for fiscal 2030, fiscal 2035, and fiscal 2040 for both operational emissions and those including Scope 3.
In setting these targets, we considered multiple scenarios, including those that align with the 1.5°C target in the Paris Agreement.
For information on our results for reduction in greenhouse gas emissions, see Prevention of Global Warming.
Greenhouse Gas Emissions Target (Scope 1+2)
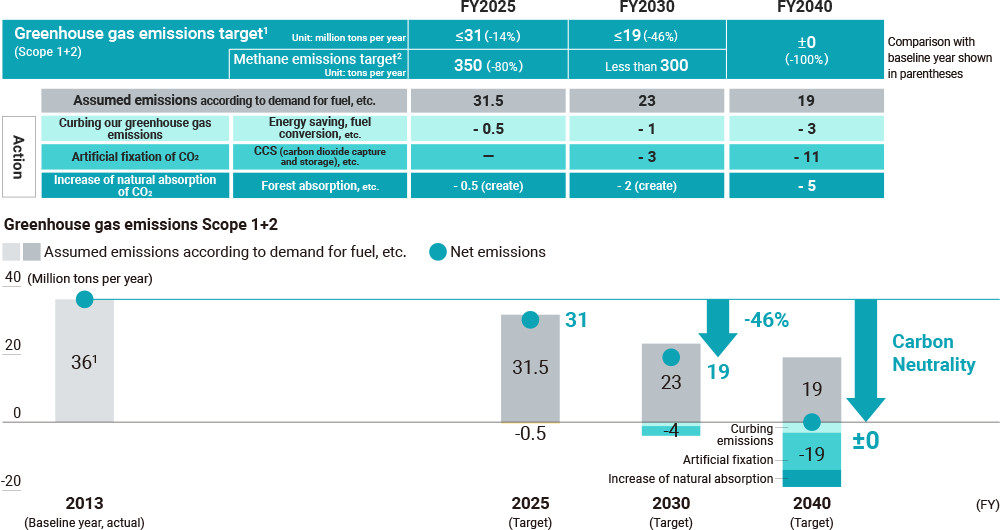
- 1Base year greenhouse gas emissions (fiscal 2013): 34 million tonnes
- 2Methane emissions (fiscal 2021): 1,600 tonnes
- 3Fiscal 2040 targets are based on the assumption that the external environment, including policies, laws, and technological progress, is sufficiently developed to enable large-scale commercialization.
Roadmap for the Reduction of Downstream Greenhouse Gas Emissions from Sold Products
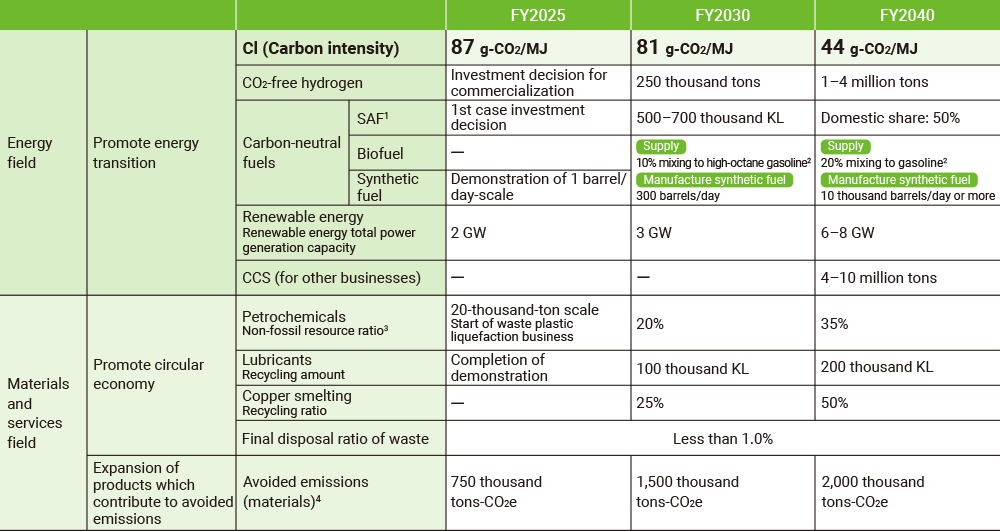
- 1The CI of supplied energy (an indicator of CO2 emissions [g] per unit of energy supply [MJ]) may be adjusted as necessary, taking into account the future application of climate change-related standards of the Sustainability Standards Board of Japan (SSBJ).
- 2The items included in CI are fuel oil, carbon-neutral fuels (biofuels and synthetic fuels), hydrogen, electricity (LNG-powered and renewable energies), CCS (implement into in-house manufacturing processes and sites to which energies are supplied), carbon offsets, and so on.
- 3Avoided emissions are estimated based on the GX League’s guidelines for emission reduction measures consistent with the Ministry of Economy, Trade and Industry’s technology roadmaps for each sector. Energy is based on stock; materials are based on flow.
- 4Ratio of products made from green chemicals to ones made from crude oil processed by a naphtha cracker